The following information relates to the first phase of the Consortium (‘VIMC 1.0’, from 2016-2022). A summary of our plans for our new project phase, VIMC 2.0 (2022 – 2027), can be found here.
Latest Impact Estimates (model runs from 2019)
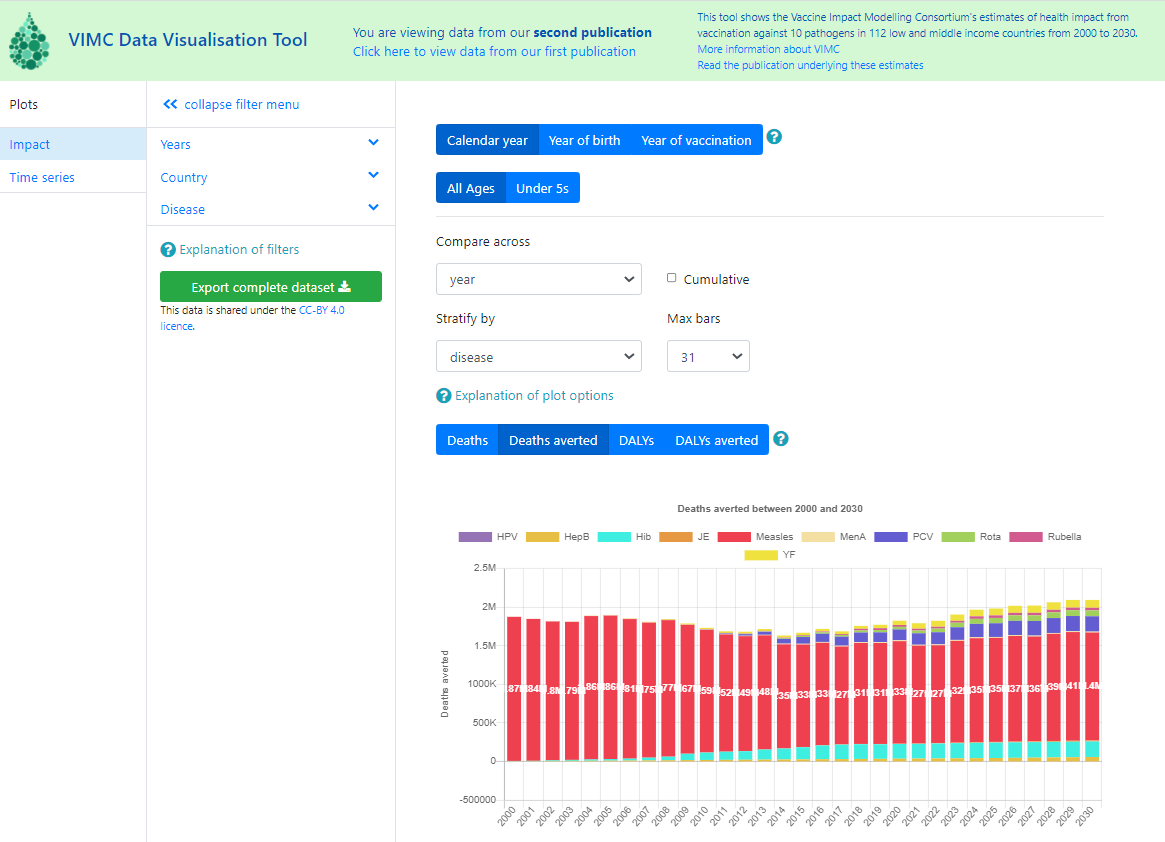
Data visualisation tool accompanying Toor et al. This displays impact estimates by calendar year, birth cohort and by year of vaccination for ten pathogens and 112 countries. See Echeverria-Londono et al. for impact methodologies. The results are based on 21 mathematical models (from 18 independent research groups). Coverage estimates are based on WUENIC release 2019 and projected thereafter.
Prior Impact Estimates (model runs from 2017)
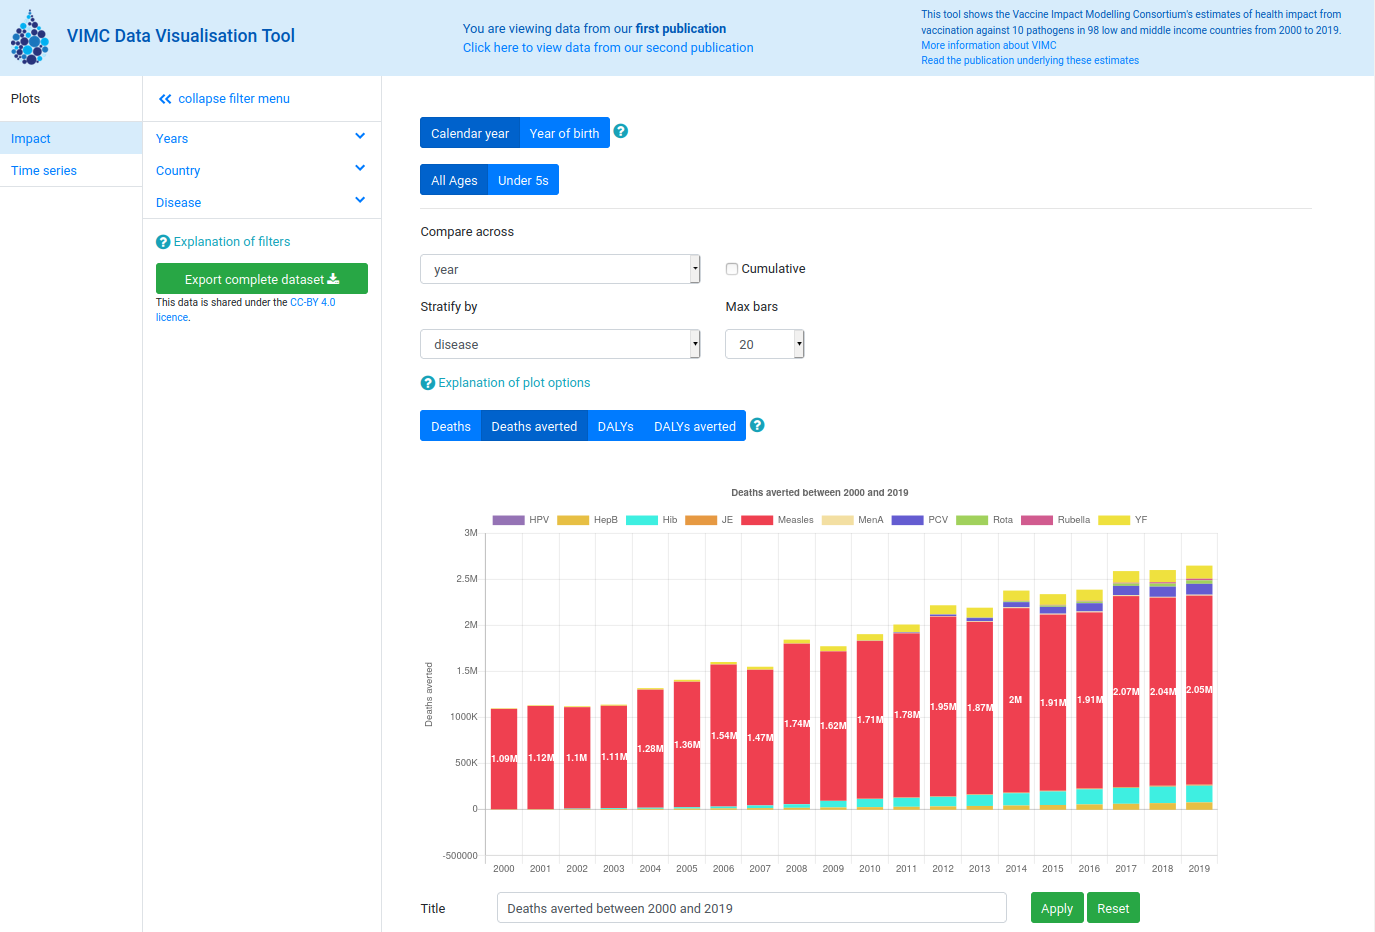
Data visualisation tool accompanying Li et al. 2021. This displays impact estimates by calendar year and birth cohort for ten pathogens and 98 countries up to 2019. The results are based on estimates from 16 independent research groups. The coverage estimates are based on WUENIC release 2017 and projected coverage thereafter.

