Plot coverage and fully vaccinated persons (FVPs)
Source:R/fn_plotting_impact.R
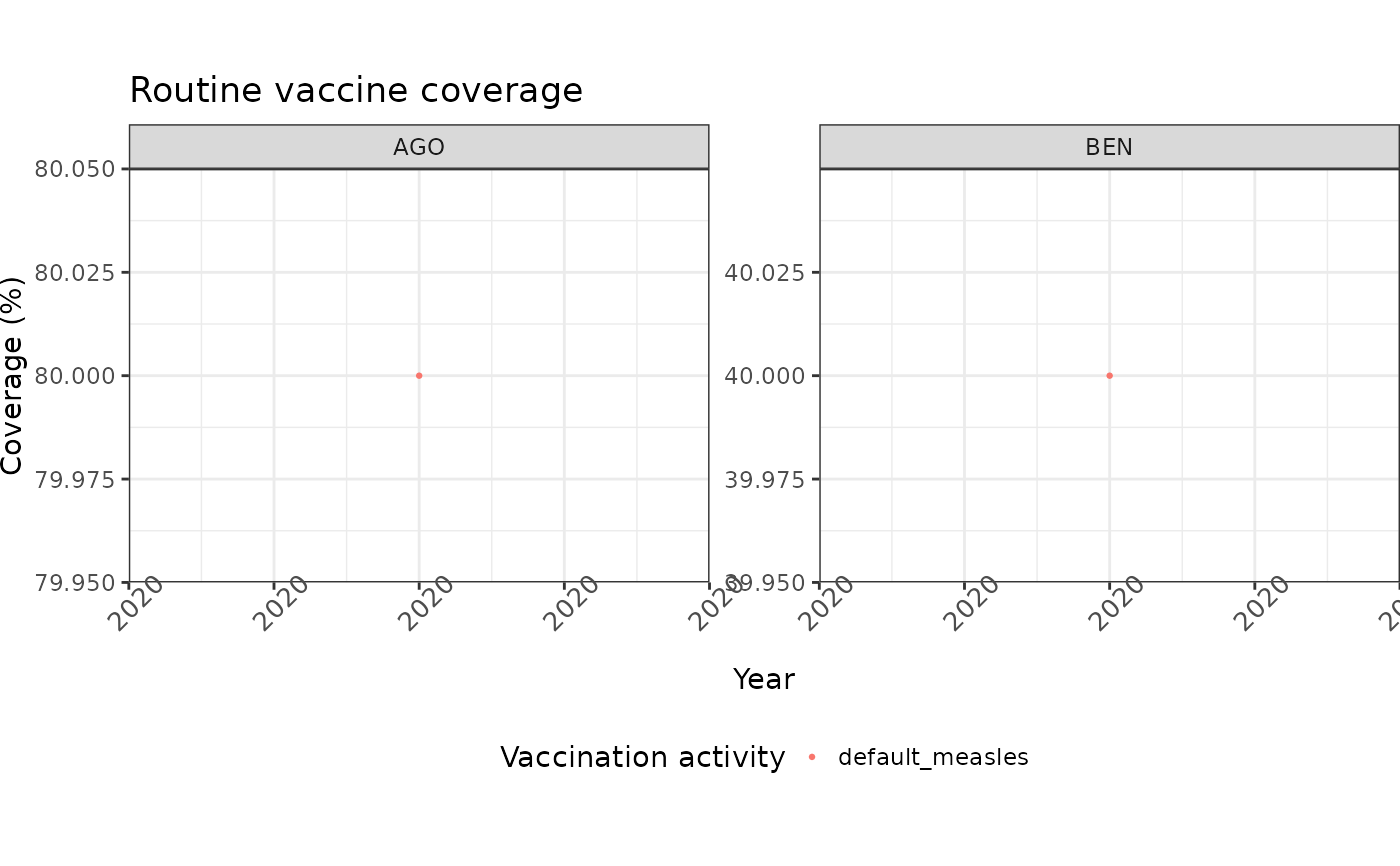
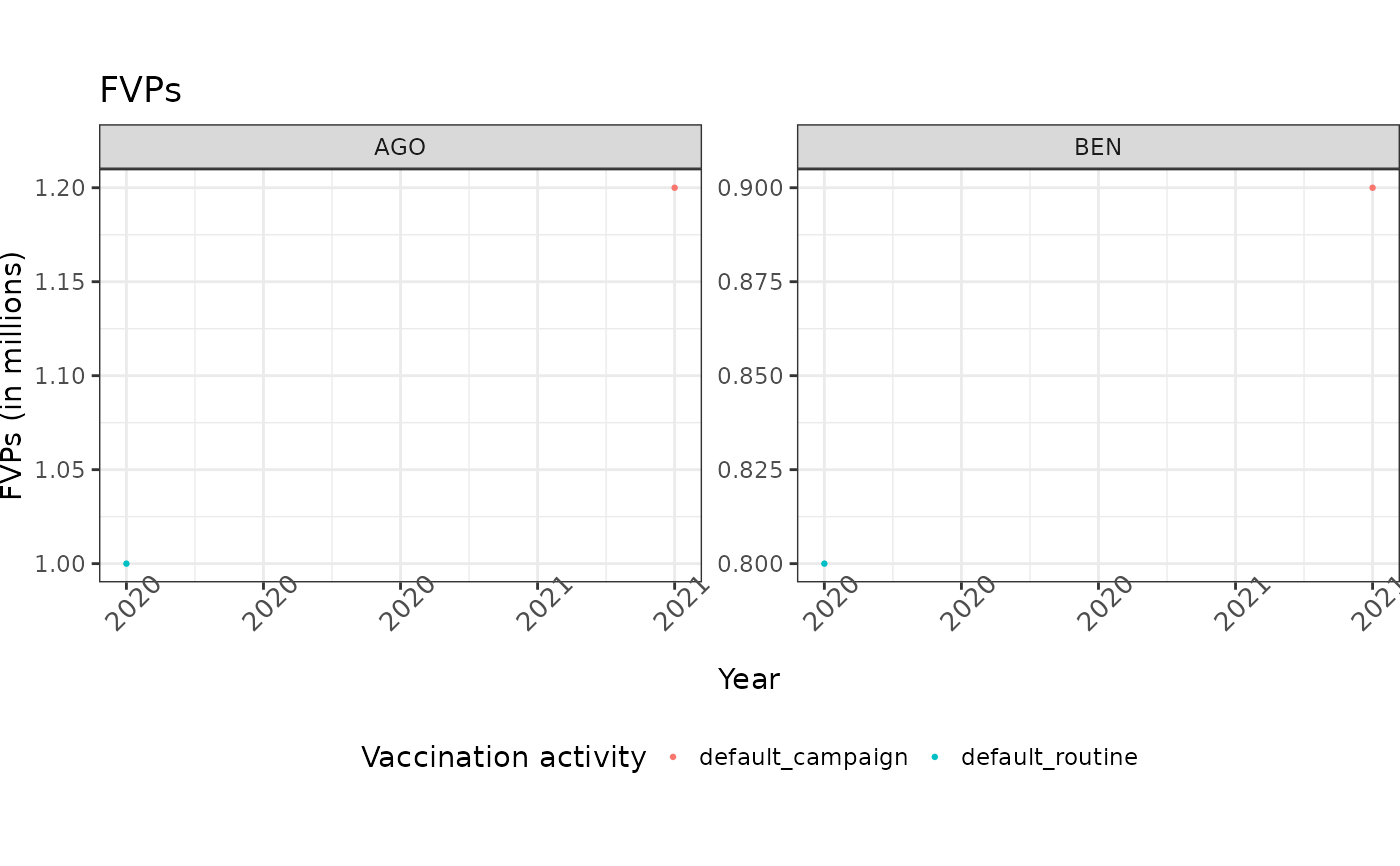
plot_coverage_fvps.RdGenerates plots of routine vaccine coverage and fully vaccinated persons (FVPs) over time for selected countries.
Value
A named list with two ggplot objects:
- coverage
A plot of routine vaccine coverage over time.
- fvps
A plot of fully vaccinated persons over time.
If there is no data on routine vaccination in the dataset, the coverage
element of the return will be an empty <ggplot> object, and a warning is
thrown.